
March Spending Report
Related Links
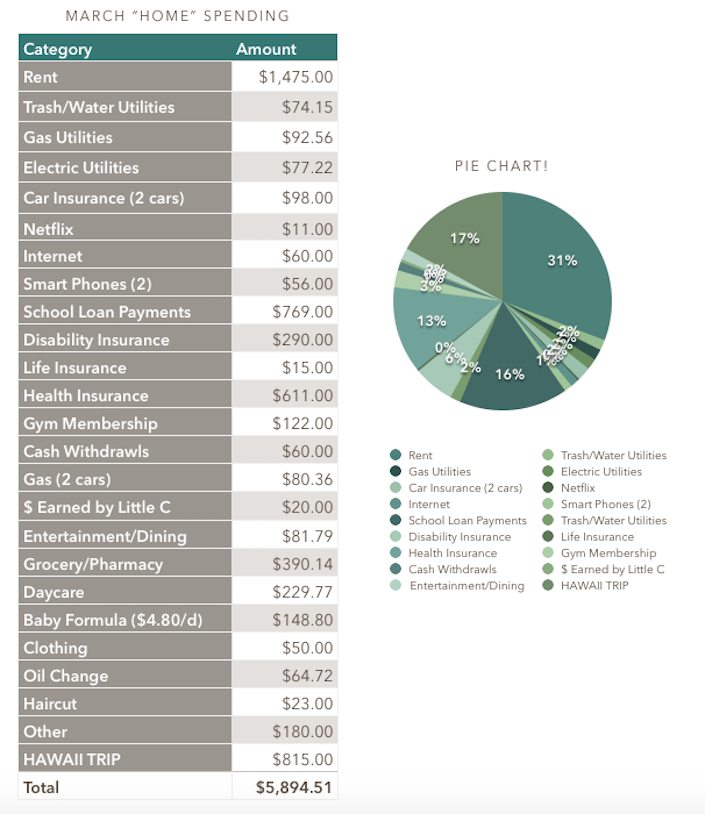
I’ll cut to the chase: We spent $5,894.51 in March for our family of four. You can scroll down to the see the breakdown of categories in our fancy Numbers chart. This total is only slightly higher than our spending in January or February, and March included our family trip to Maui (some of our most-effective-ever travel hacking, which we are very proud of).
You can read here about our ongoing efforts to crush our student loans into the dust. You can read here and here about some of our unconventional approaches to the financial side of raising kids.
Just in case you are curious about our budgeting system: we call it the Non-Budget.
And remember: We call this a “spending” report on purpose – not “our expenses” or “our costs of living” or anything else that implies that our use of our money is something that just happens to us while we sit there in helplessness.
Here is a picture of a sea turtle taken while we were snorkeling in Wailea, which has nothing to do with this topic but is arguably more interesting than a picture of money:

Notes About These Numbers
(If you already read the January or February reports, you’ll find these notes are about the same. You can scroll on down to the charts below.)
-I have not included our charitable giving here, which can be a very sensitive subject for a lot of people (especially those who feel like they are drowning in debt). But unless you yourself are about to starve or freeze to death due to lack of basic resources, I recommend you find at least one charitable organization you are really excited about and send them monthly donations via auto-draft, even if it’s a small amount. Many charities desperately need people who can commit to monthly financial support.
-This list does not include our HSA, stock investments, or our real estate investments. I am planning to write more about how we approach our savings and investments soon.
-This list does not include business loan payments, professional dues, licensing fees, malpractice insurance, or other expenses that are due exclusively to our business ownership and – unlike my student loans – would go away if I sold the business and switched careers.
-The student loan payment shown is what I have on auto-draft. We are paying extra on our loans every month in an effort to be done with them this year. I include student loans in “home” spending even though they are related to my career because they don’t go away no matter what I do career-wise.
-We have health insurance and an HSA though my husband’s work as a teacher. It’s actually a pretty great deal, all things considered. We pay out of pocket for dental care and eye care services as needed.
-All “Entertainment/Dining” expenses are 100% optional expenses. For us, these tend to be things like going to the movies and eating at Chick-fil-A.
-I include life and disability insurance in this list even though they are sort of related to work, because they are what protect our current lifestyle. My disability insurance is expensive because it is important to us to be able to pay off all our debts and live well even if I am unable to work.
-“Groceries” includes food, household items, medications, toiletries, and diapers purchased at Sam’s Club or grocery stores or pharmacies like Walgreens.
-I have separated baby formula out because it is a significant expense that will not apply to everyone and will go away in a few months for us. All other baby-related expenses (aside from clothing) are included in “Grocery/Pharmacy”.
-This list does not include at-home babysitters, who we occasionally pay in cash to watch our kids. Any at-home babysitters we pay are non-essential, although very much appreciated. The daycare we pay for while we are both at work (which is very much essential as long as we both want to work) is listed under “Daycare”.
-The category called “$ Earned by Little C” is what our 11 year-old earns by doing things like reading out loud for the family and doing miles on the treadmill ($0.20 per mile). We don’t do a traditional allowance.
Without further ado, here is our home/family spending for March of 2018, in the form of a sophisticated screenshot from a Numbers document:
The Charts!
Ta-da! I have actually kept track of and posted our spending reports for the whole first quarter of 2018!
The plan is to continue doing this for the rest of the year. And if you don’t know off the top of your head what you spend each month, I strongly encourage you to start a Numbers chart of your own. You might be surprised at what you see.